Overview
Deeper Analysis
Presentation
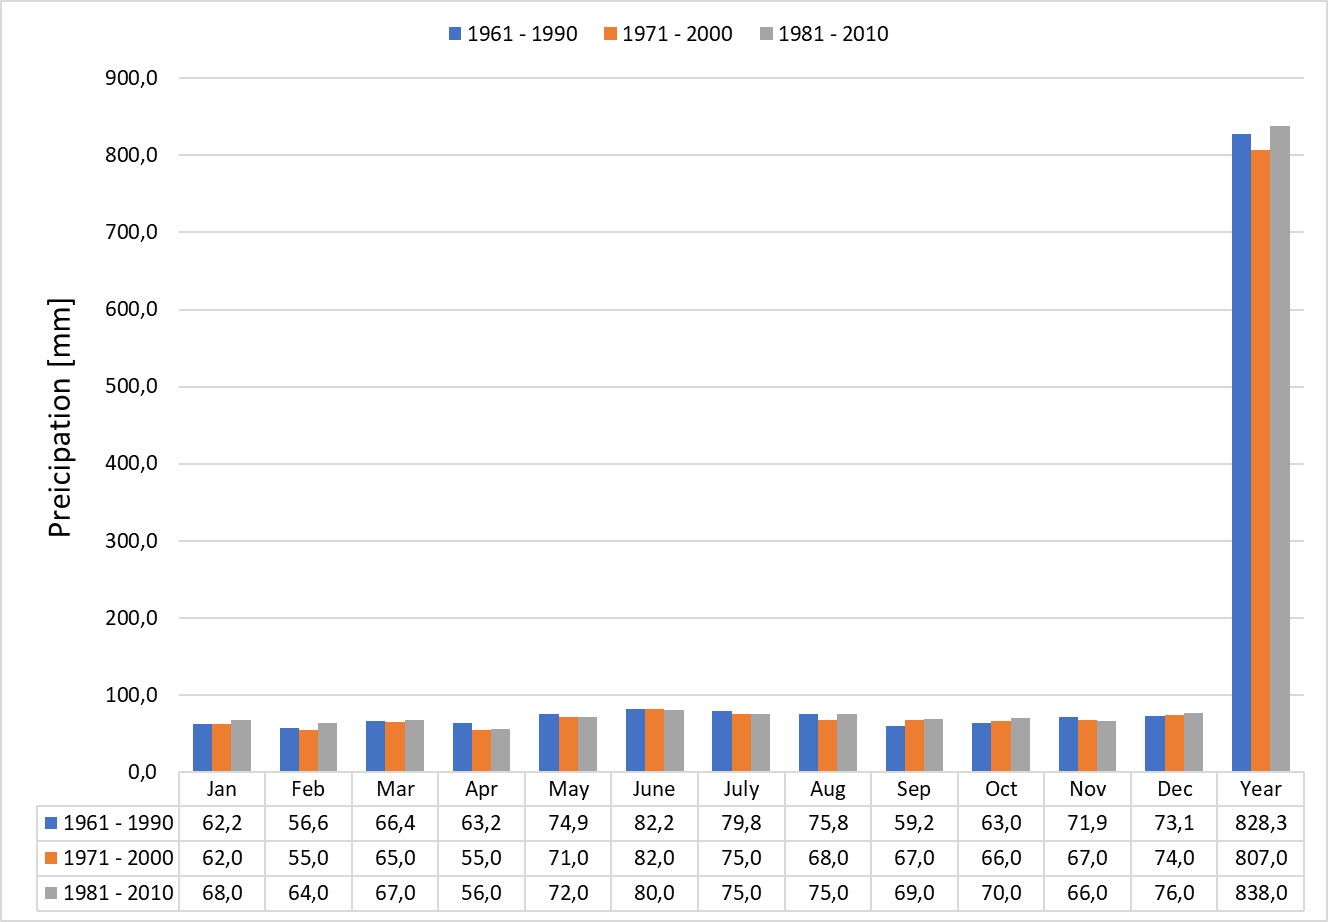
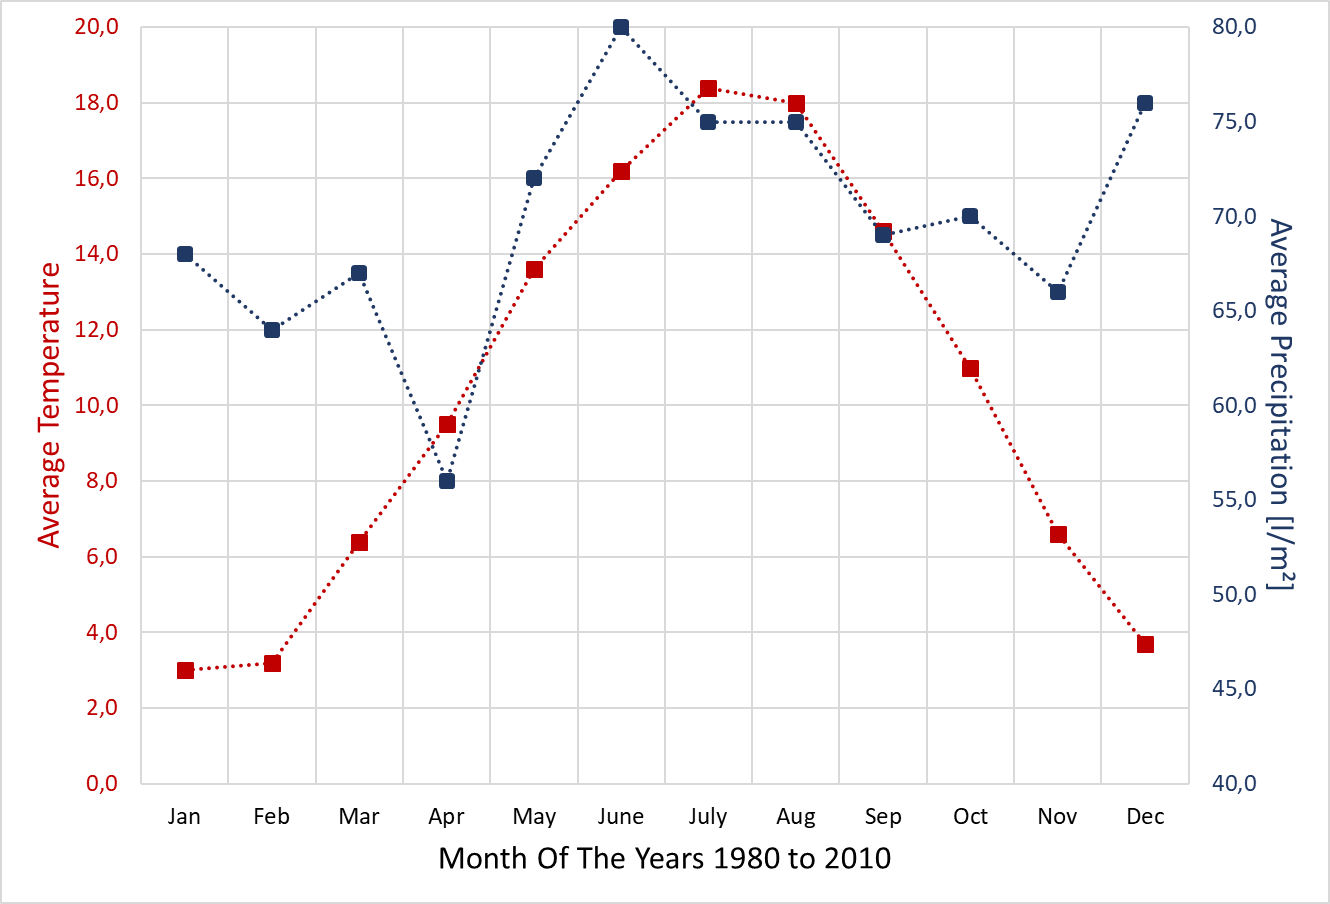
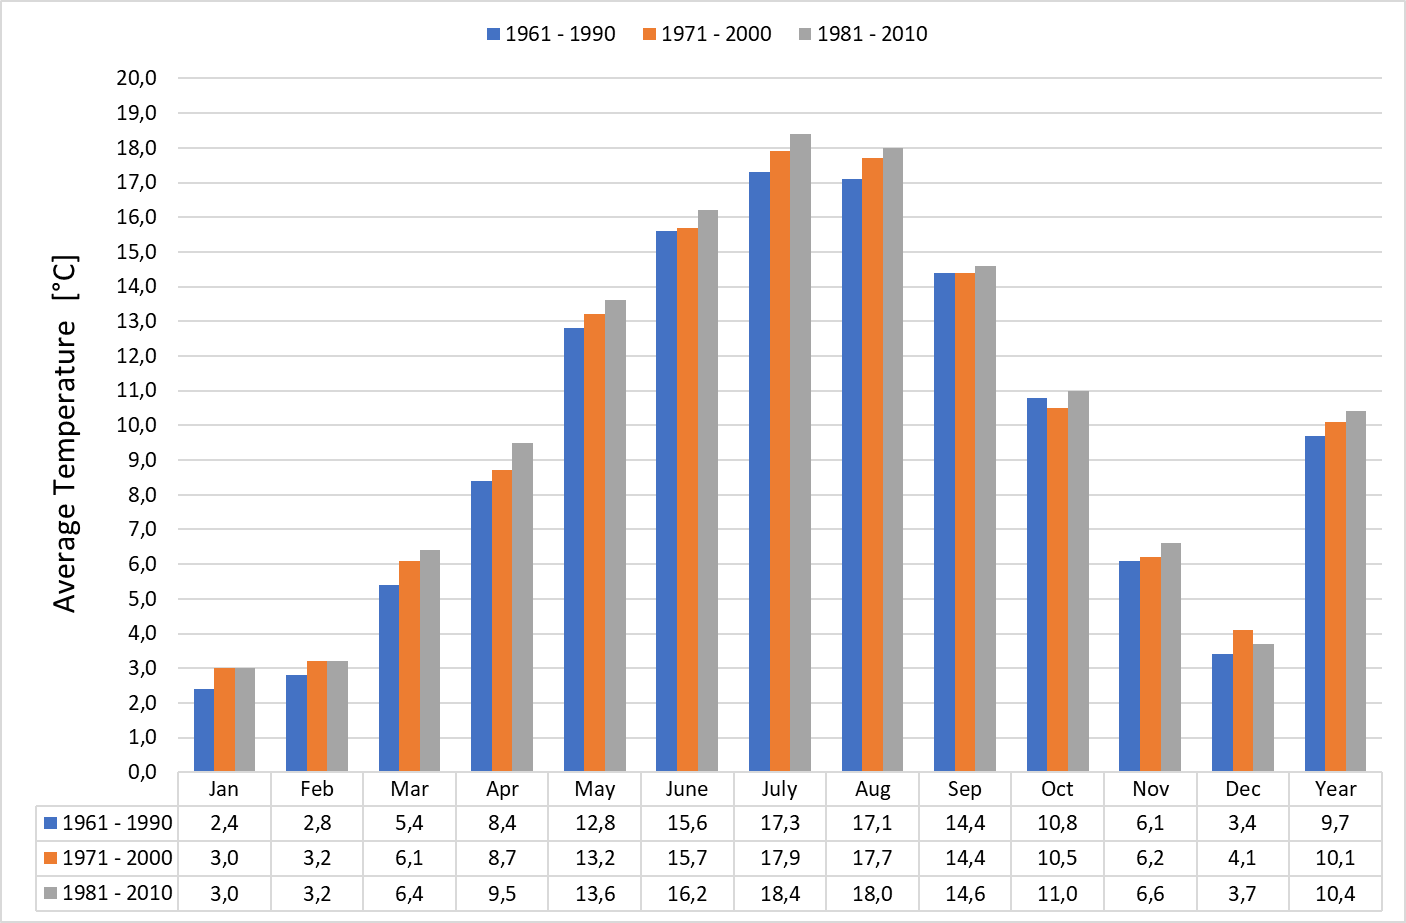
Some signifikant measures are used to give a more detailled view on the climate in Würselen. First of all, all measures are basically averages over a 30 years period of time. The relevant periods are 1961 to 1991, 1971 to 2000 and 1981 to 2010. Hence, the analysis relies on slidending averages.
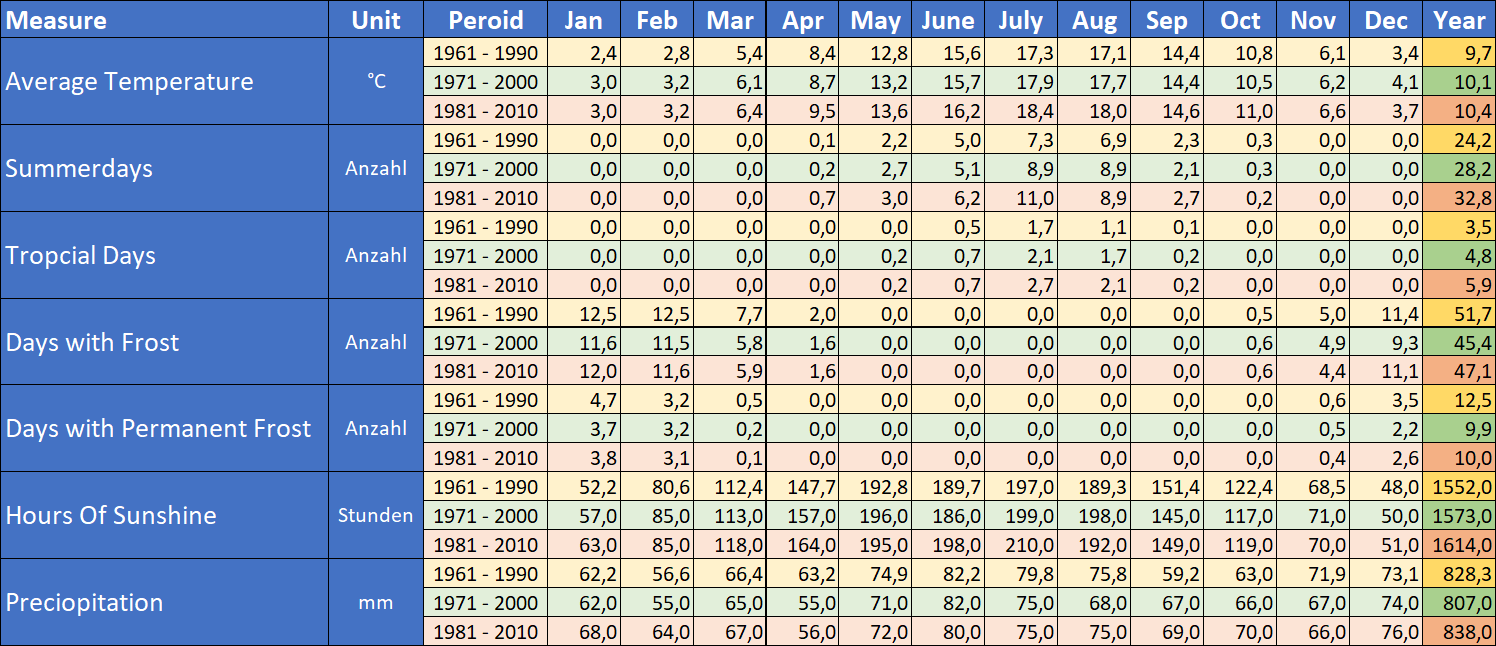
The presentation starts with a table that provides all data used later on.
Datasource
![]() All climate data were taken from the relevant tables of the Deutschen Wetterdienst (DWD) (The governmental weather service in Germany). The data are used according to the Opendata-License of the DWD. webWürselen analyzed the specific data of the weather records of the station near Aachen (ID = 3). This is the nearest DWD's station to Würselen. The bearing is 6°01' East, 50°48' North.
All climate data were taken from the relevant tables of the Deutschen Wetterdienst (DWD) (The governmental weather service in Germany). The data are used according to the Opendata-License of the DWD. webWürselen analyzed the specific data of the weather records of the station near Aachen (ID = 3). This is the nearest DWD's station to Würselen. The bearing is 6°01' East, 50°48' North.
Basic Table
Keys

Average Temperature
Number of summerdays
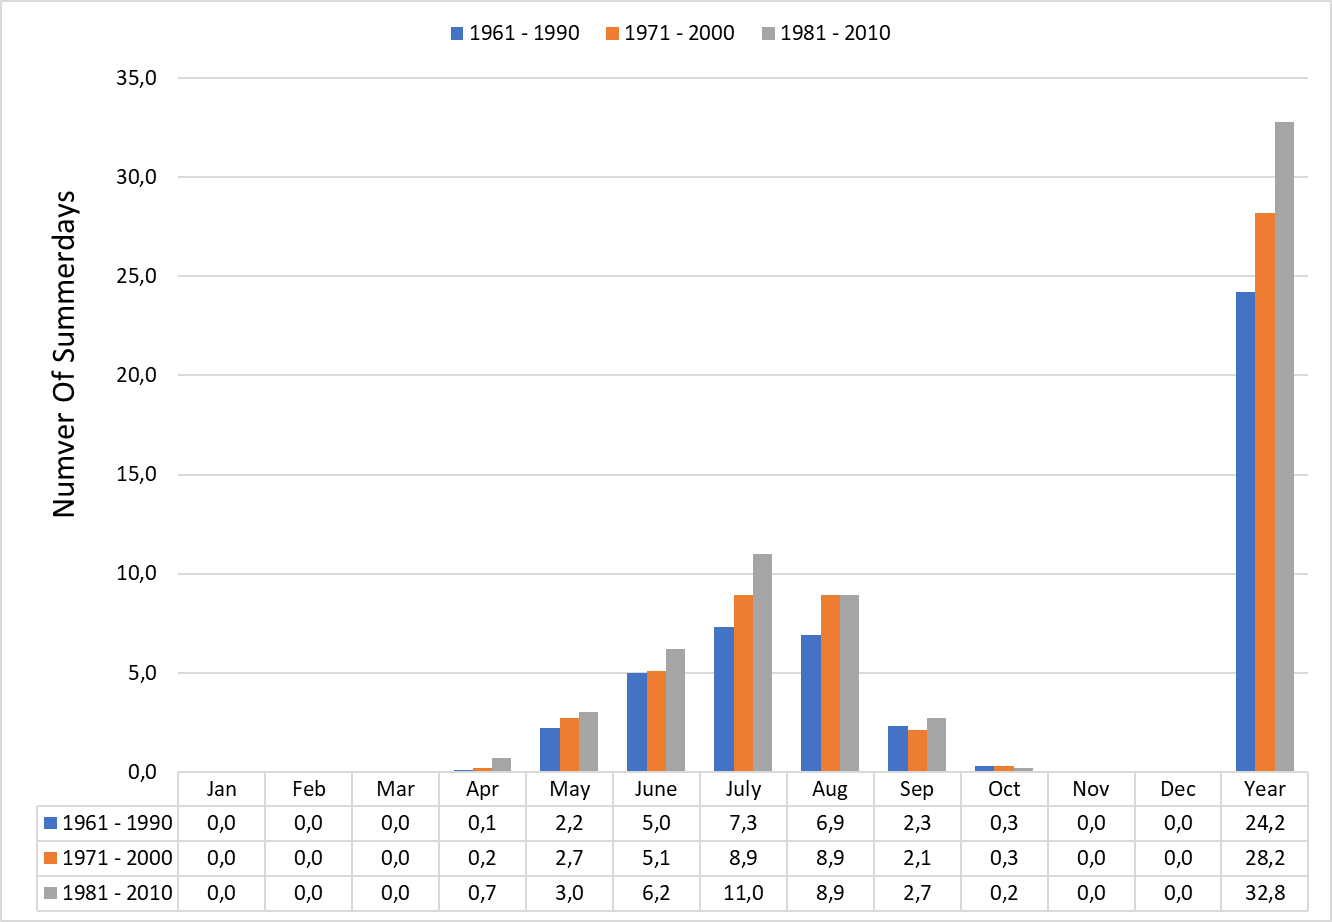
Number of tropical days
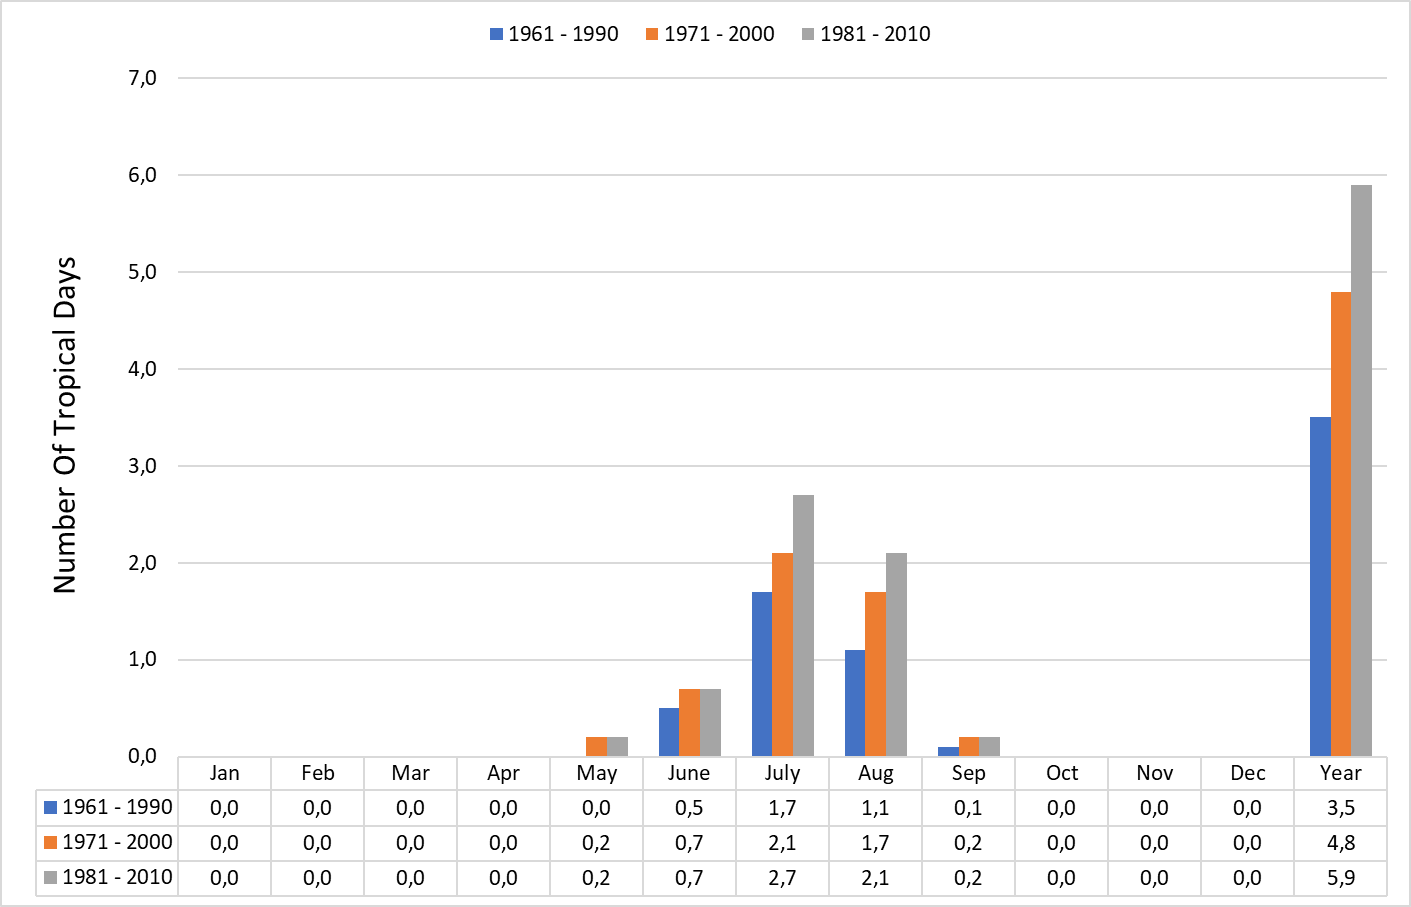
Number of days with frost
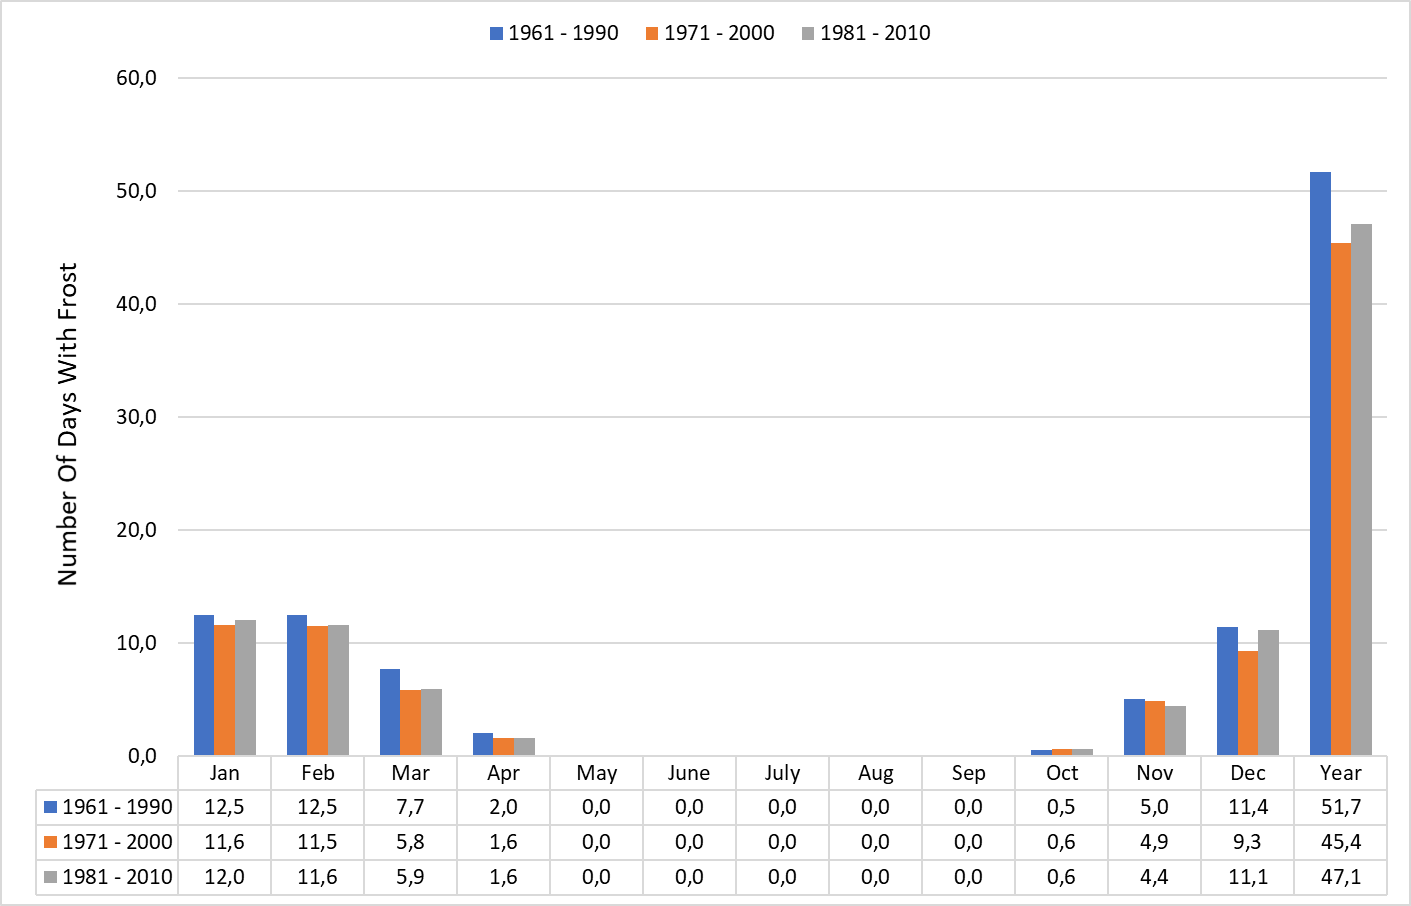
Number of days with permanent frost
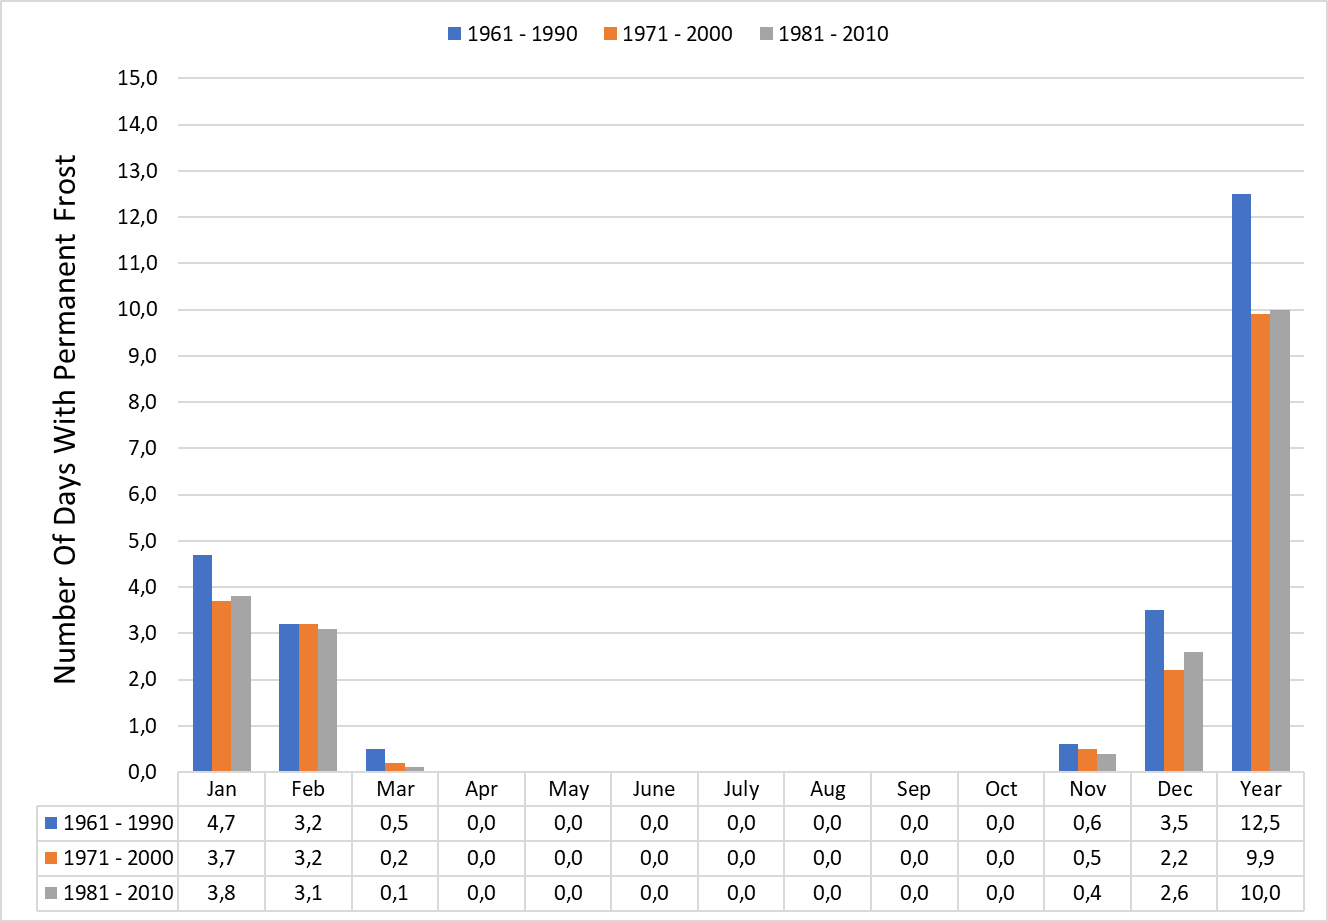
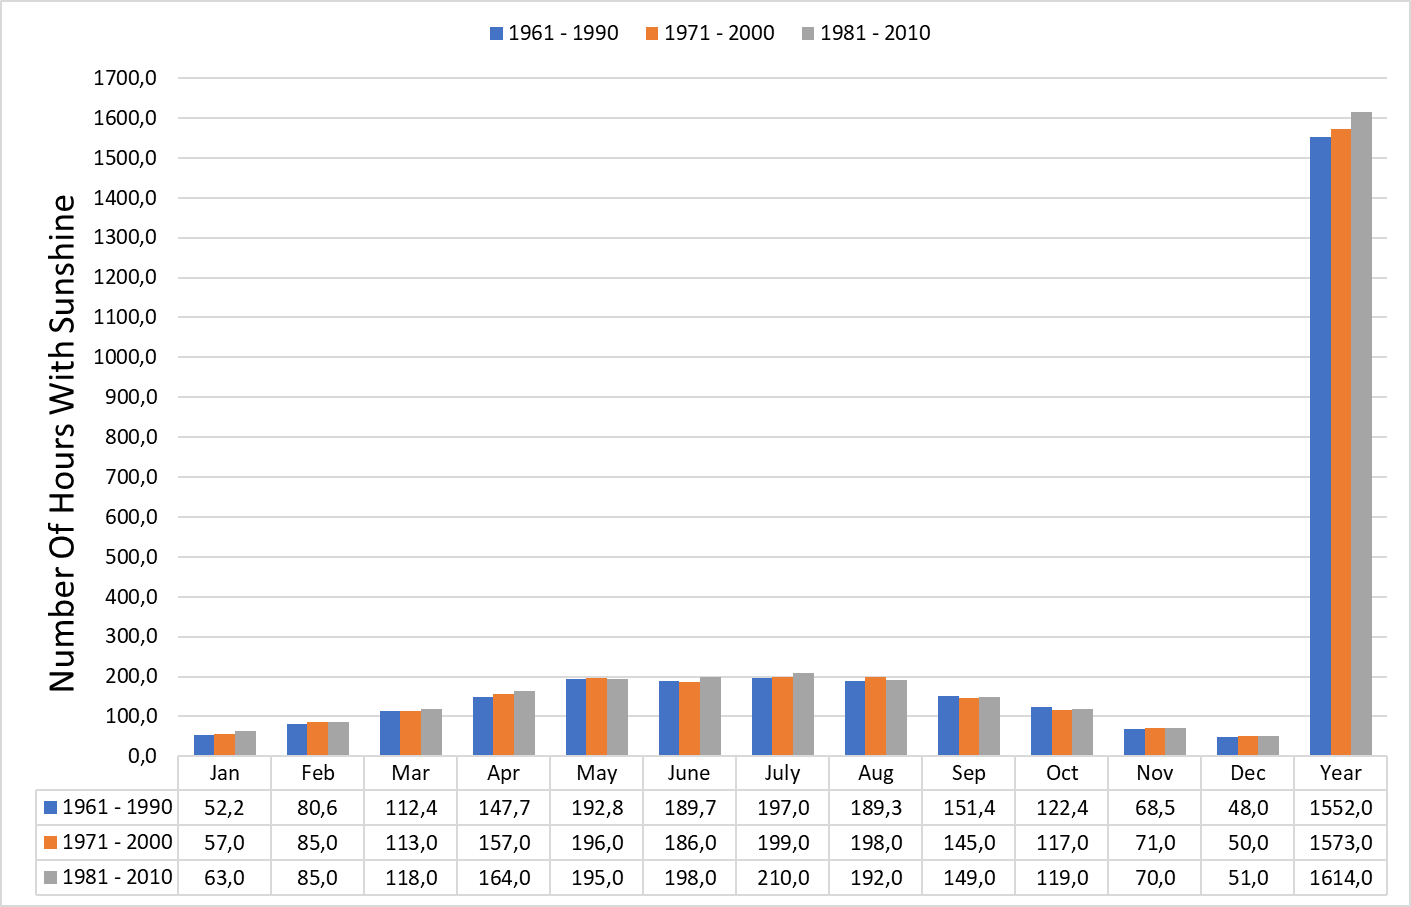
Number of hours with sunshine
Precipitation
