Copso-Map, dated 1777, remastered by E. Arnold, 1923
History
Land-Use-Plan
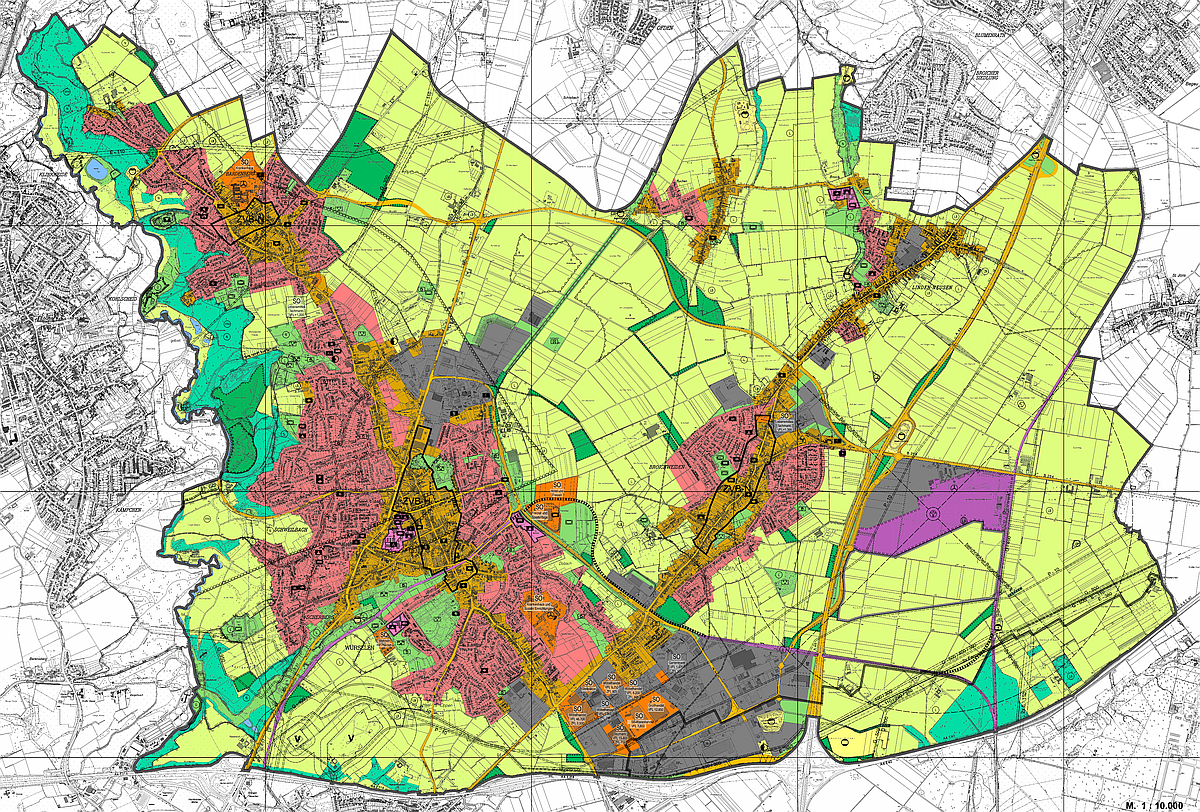
Source: StädteRegion Aachen (2018)
OpenData License Germany - Version 2.0 (www.govdata.de/dl-de/by-2-0)
You can analyse the land-use-plan online at Geoportal Städteregion Aachen
Map 1936 - 1945
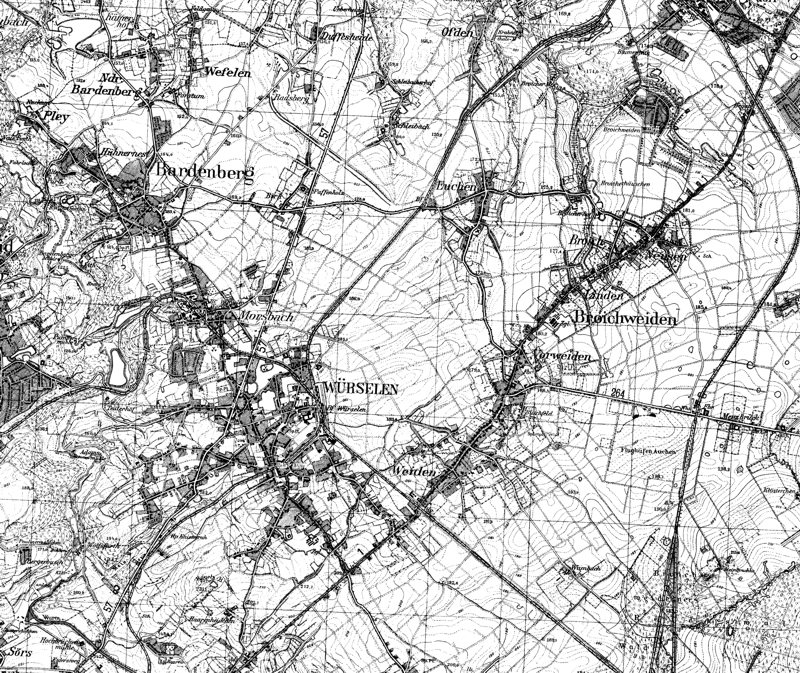
Source: Land NRW (2020) Datenlizenz Deutschland -Namensnennung - Version 2.0 (http://www.govdata.de/dl-de/by-2-0)
Historic map Würselen, 1936-1945.
Please click the map to see the full view.
Overview
 Presentation
Some signifikant measures are used to give a more detailled view on the climate in Würselen. First of all, all measures are basically averages over a 30 years period of time. The relevant periods are 1961 to 1991, 1971 to 2000 and 1981 to 2010.
Wind
Collection of data
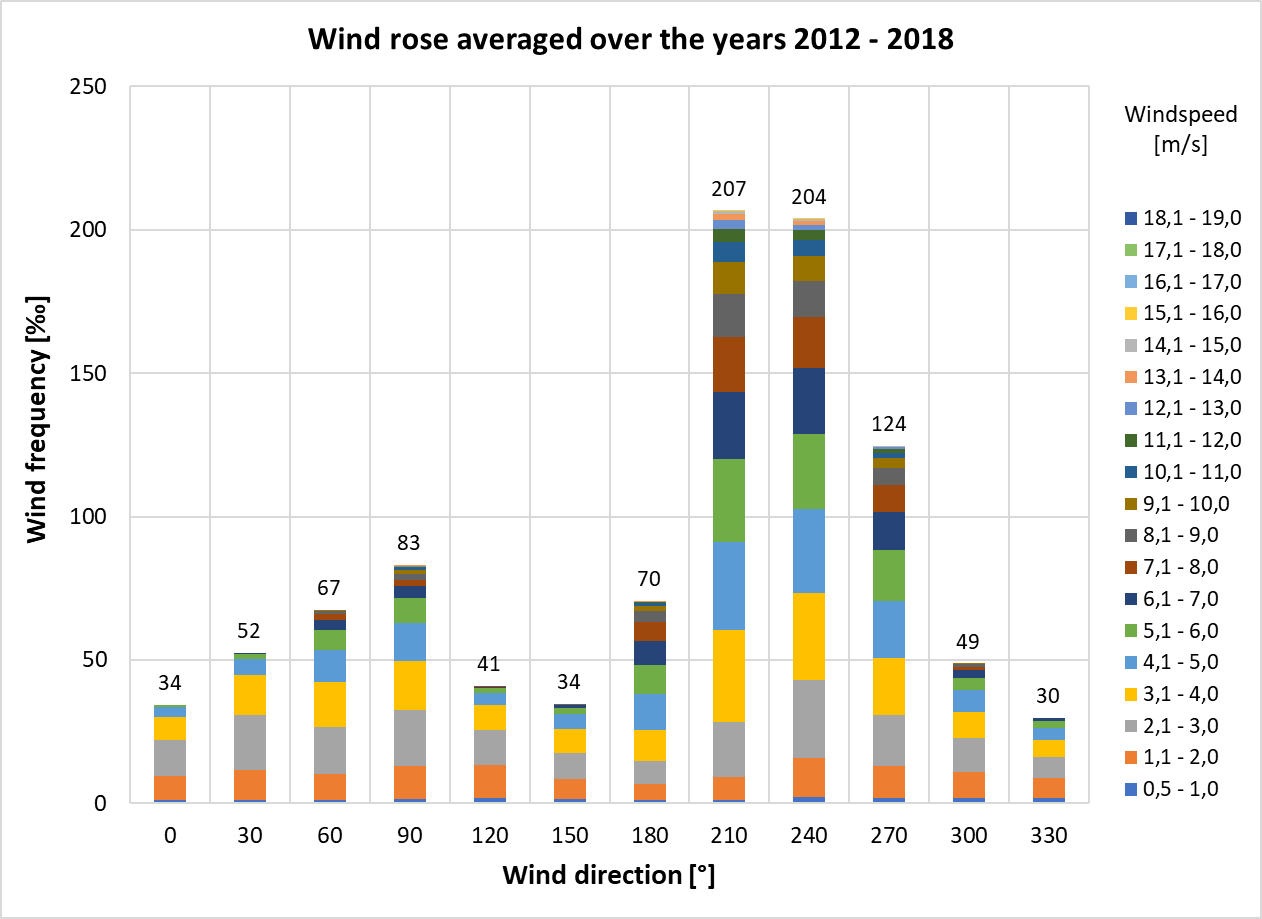
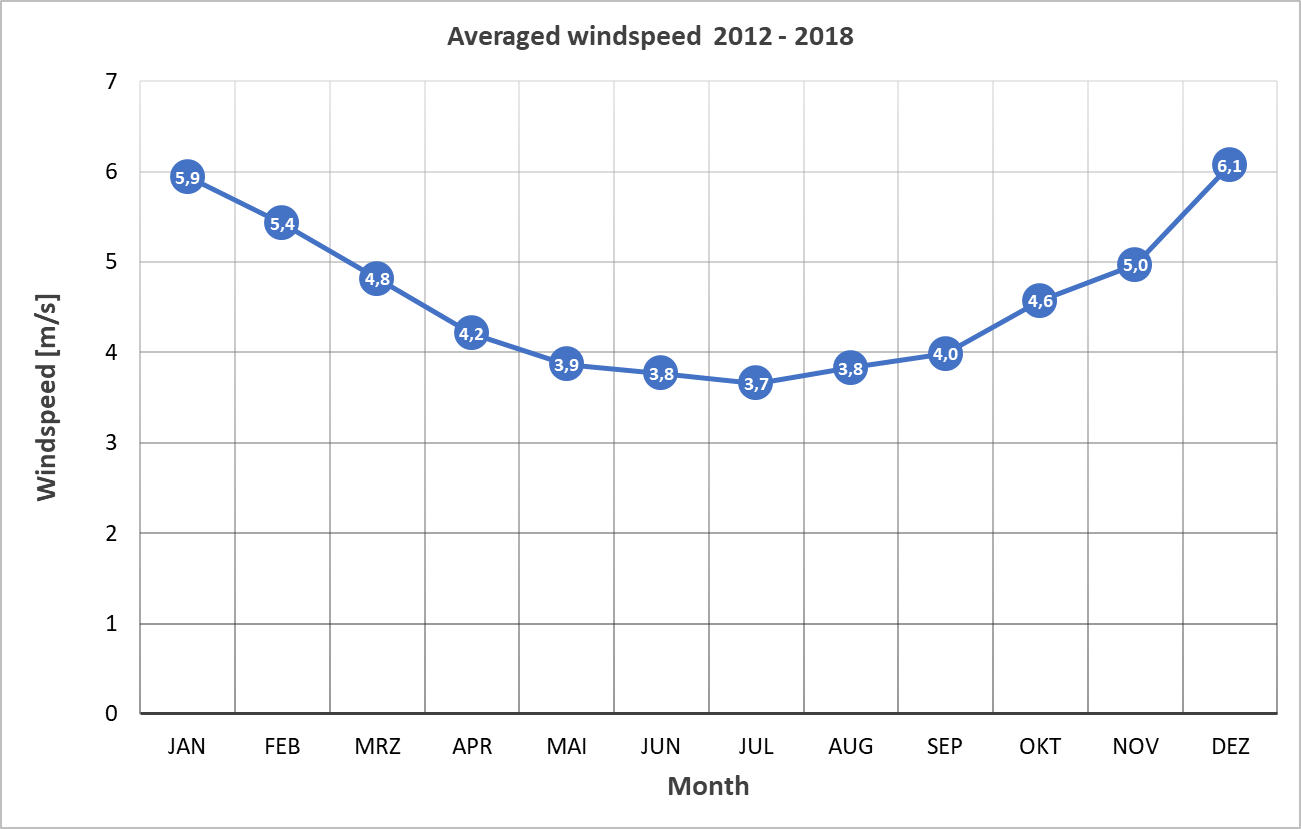
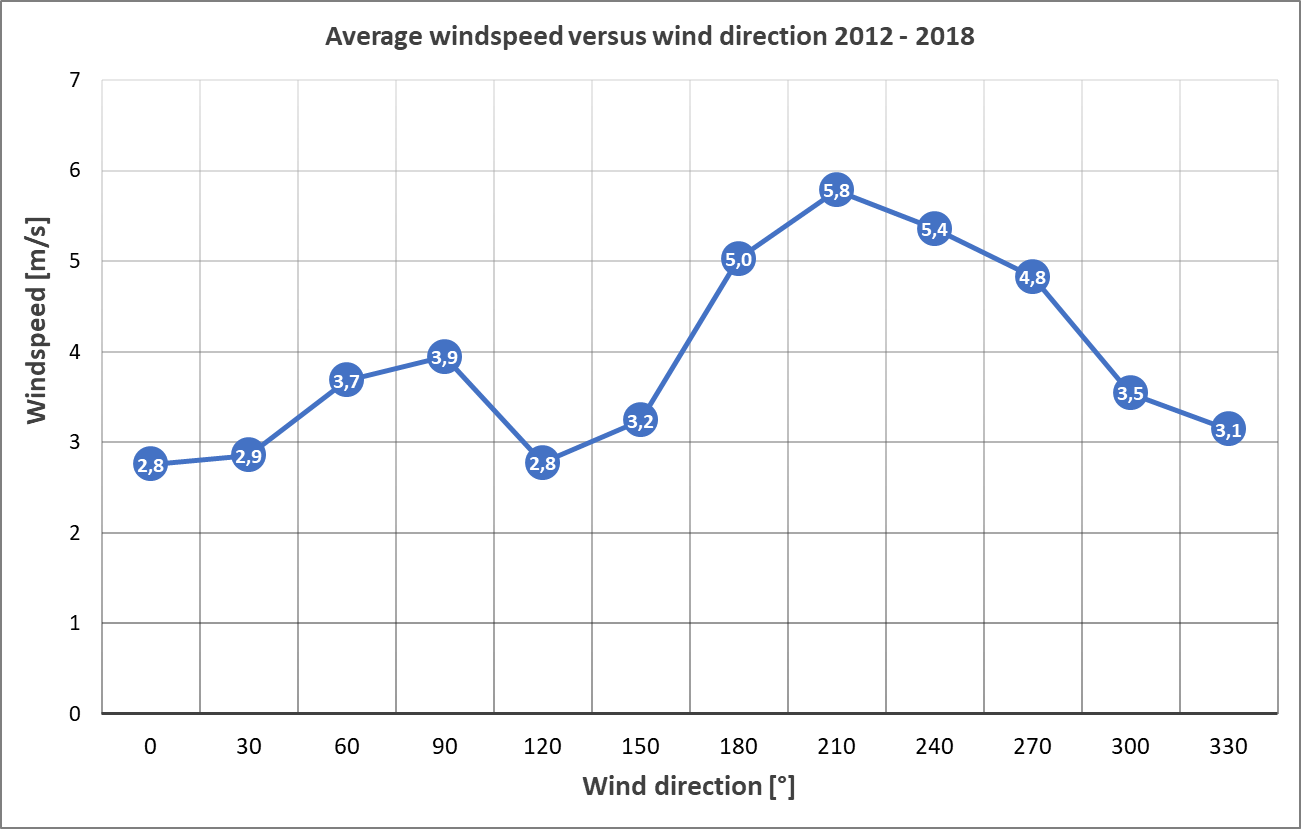
The following diagrams indicate the wind based on yearly data from 2012 to 2018.
Wind rose
Windspeed versus months
Windspeed versus direction
Datasource
![]() The wind data were taken from the relevant information of the Deutschen Wetterdienst (DWD) (The governmental weather service in Germany). The license to use the data was obtained through the DWD-Shop, billing reference 915023478956. webWürselen analyzed the specific data of the weather records of the station near Aachen (ID = 3). This is the nearest DWD's station to Würselen. The bearing is 6°01' East, 50°48' North.
The wind data were taken from the relevant information of the Deutschen Wetterdienst (DWD) (The governmental weather service in Germany). The license to use the data was obtained through the DWD-Shop, billing reference 915023478956. webWürselen analyzed the specific data of the weather records of the station near Aachen (ID = 3). This is the nearest DWD's station to Würselen. The bearing is 6°01' East, 50°48' North.
Precipitation
Collection of data
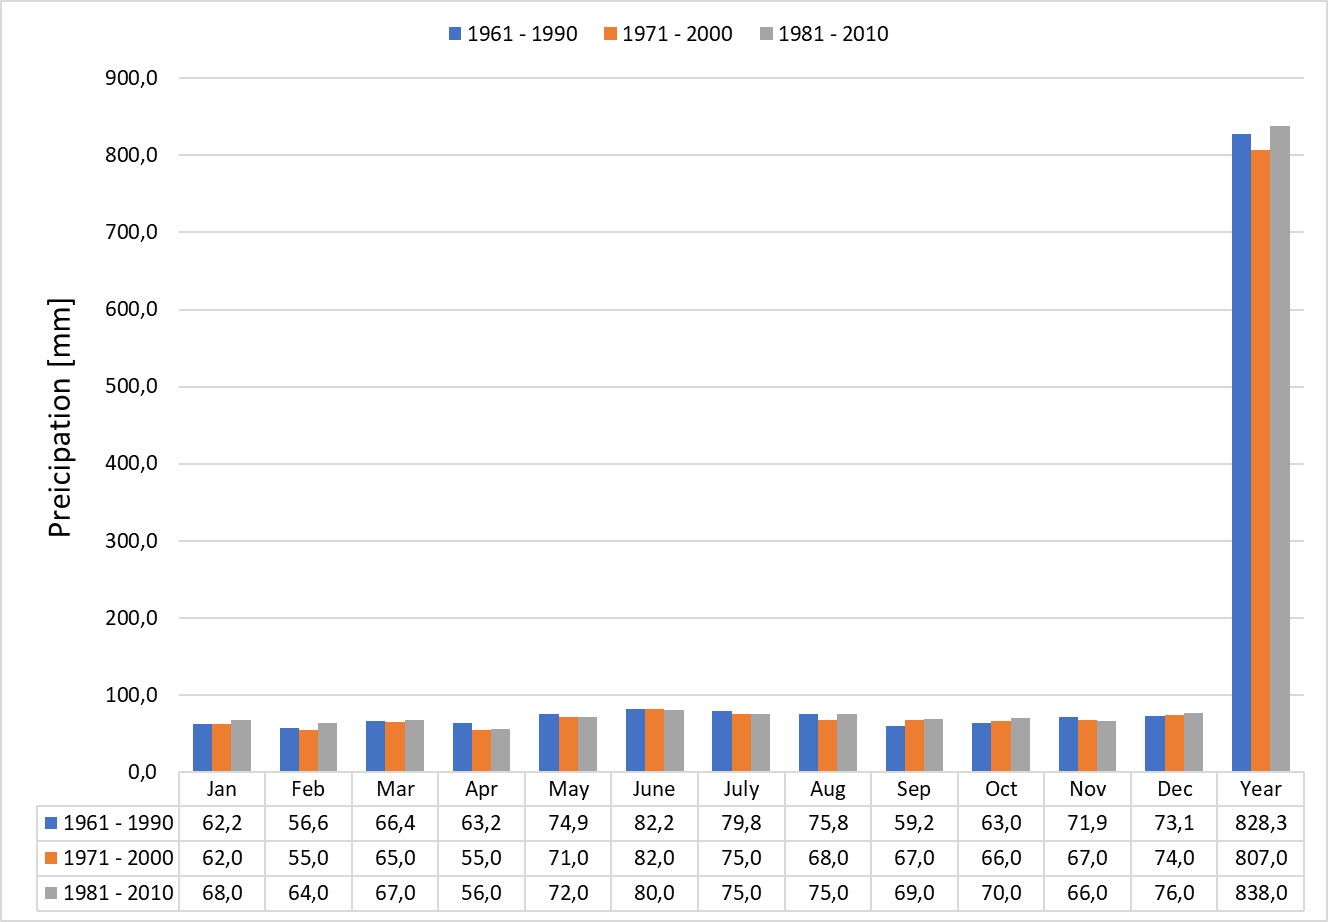
The following diagram indicates the rainfall and snowfall given for the three so-called reference time periods from 1961 to 1990, from 1971 to 2000 and from 1981 bis 2010. Each reference time period covers 30 years.
Precipitation
Datasource
![]() All climate data were taken from the relevant tables of the Deutschen Wetterdienst (DWD) (The governmental weather service in Germany). The data are used according to the Opendata-License of the DWD. webWürselen analyzed the specific data of the weather records of the station near Aachen (ID = 3). This is the nearest DWD's station to Würselen. The bearing is 6°01' East, 50°48' North.
All climate data were taken from the relevant tables of the Deutschen Wetterdienst (DWD) (The governmental weather service in Germany). The data are used according to the Opendata-License of the DWD. webWürselen analyzed the specific data of the weather records of the station near Aachen (ID = 3). This is the nearest DWD's station to Würselen. The bearing is 6°01' East, 50°48' North.

